DEEP Neural Networks
show how the brain is wired
Color Coordinates
Color space is shown in figures A and B in the interactive color vision model below. The figures are also shown in figures 2 and 3 in article #1 in Related Articles.
Color space is determined by normal human perceptions of different colors. If people are asked to arrange colored chips so that similar colors are next to each other, the chips are arranged in a circle like the horizontal circle in figure A below. This is the "color wheel" developed by Isaac Newton in 1666. If chips are included with colors that are desaturated with black and white, that is, dark and light colors, the chips are arranged roughly like the solid figure A, with white at the top and black at the bottom and shades of gray down the middle. This is Munsell's color solid, first described by Albert Munsell in 1905.
.png)
This discussion supplements the explanation in the Color Vision Model's "Color Space" button. It refers to that page's two depictions of Color Space, Figures A and B.
Contrary to a widely accepted notion, Color Space is not three dimensional simply because we have three classes of photoreceptors that are sensitive to different wavelengths. There’s quite a bit more to it than that.
Surprisingly, color space as depicted in figure B above consists of four three-dimensional regular tetrahedra. A regular tetrahedon is a pyramid with four equilateral triangles for faces). Here is where things get strange. The four tetrahedra are embedded in four separate four-dimensional spaces. Because the four spaces have six different coordinates, they are joined at their common faces by embedding them in six-dimensional space. The six outputs of the color vision model above are rectangular coordinates of this figure.
I was so astounded when I discovered this, I could hardly believe it. Of all the phenomena produced by the color vision model, this is the most surprising and possibly the best evidence that the model shows how neurons are actually connected.
The six outputs of the color vision model provide cylindrical coordinated of hue, saturation, and value for the space, as depicted in figure A. The two figures are different representations of the same space.
The Color Space generated by the FFD model is a small extension of the familiar concept of a one-dimensional line on a two-dimensional plane, or a two-dimensional triangle on the side of a three-dimensional pyramid. Since spaces with more than three dimensions are beyond human capabilities of visualization, it is worth comparing the following discussion to the one-dimensional line segment in the first quadrant of the plane defined by x + y = 1 (Figure 1 below). Even better, if you’re familiar with three-dimensional coordinates, consider the triangle in the first octant defined by x + y + z = 1 (Figure 2).
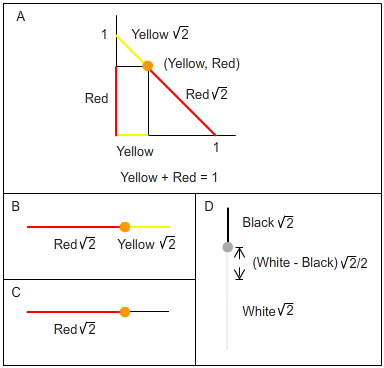
Figure 1. Line segment.
A. A one-dimensional line segment in a two-dimensional plane. B. The line segment in one-dimensional space with the two-dimensional coordinates. C. Although two coordinates are necessary to determine a point on a line in 2-space, either one of the coordinates is enough if the line is confined to 1-space. D. Two coordinates are combined to place the origin in the middle of the line segment. For convenience, this method is used (below) for the z value of Color Space’s cylindrical coordinates.
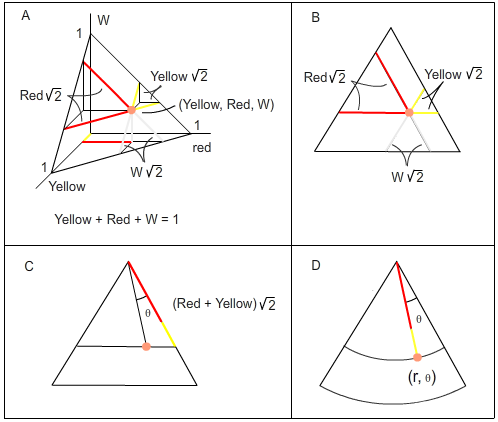
Figure 2. Triangle.
A. A 2D triangle in 3-space. B. The triangle in 2-space with the 3D coordinates. Any two of the coordinates are enough to determine the point in 2-space. C. The point defined by the sum of two coordinates and an angle determined by straightforward trigonometry. D. A topologically equivalent rendering of the triangle with polar coordinates.
Rectangular Coordinates
The network’s six output values can be considered the coordinates of a point in six-dimensional Euclidean space. Their values between 0 and 1 (or 100%) restrict the points to a bounded subset of 6-space. At most four coordinates can have positive values simultaneously (Black, Red or Green, Blue or Yellow, White). This reduces Color Space to four four-dimensional subsets of 6-space. For example, the set of points where Green = 0 and Blue = 0 is a four-dimensional subset. The further restriction that the outputs’ sum is 1 reduces Color Space to four regular tetrahedra.
Fortunately this means Color Space is a three-dimensional figure that can be visualized, as shown in Figure B in the Color Vision Model. Four pairs of tetrahedra share a common face, and all four tetrahedra have a common edge that lies between the Black and White vertices. One of these tetrahedra is shown in Figure 3. It is defined by Green = 0 and Blue = 0, so the summation equation becomes Red + Yellow + Black + White = 1. The tetrahedron has vertices at Red = 1, Yellow = 1, Black = 1 and White = 1.
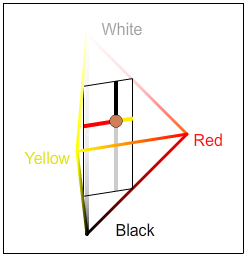
Figure 3. A color point in one of the four tetrahedra that make up Color Space.
The figure shows a three-dimensional tetrahedron in four-dimensional space defined by the equation Red + Yellow + Black + White = 1. For any point in the space, each of the four coordinates (Red, Yellow, Black, White) is the distance from the point to the tetrahedron’s face opposite the vertex where that coordinate equals one. The distance is measured along a line parallel to any of the three edges meeting at that vertex. In the figure, one of the three possible measured directions is shown as a colored line segment.
As an example of how the coordinates work, the Red coordinate of a point in the Red-Yellow-Black-White tetrahedron is the distance from the point to the face opposite the Red vertex, measured along a line parallel to any of the three edges containing the red vertex. To be completely accurate, this distance is the Red coordinate times the square root of 2. This is because each edge has length square root of 2. The edge length can be found simply by the distance formula between any two of the vertices. Compare this coordinate geometry to the analogous lower-dimensional cases in Figure 1B and especially Figure 2B. For convenience in stating the coordinate values, the tetrahedra’s edges in Figure B of the Color Vision Model are scaled to have length 1 (100%). For the same reason, the Black-White, Red-Green, and Blue-Yellow axes are scaled to have length 2.
You may have noticed that the tetrahedra as depicted in Figure B of the Color Vision Model cannot be regular (equal edge lengths). Their faces make right angles at the Black-White axis, and the edges cannot all have the same length. This is because the regular tetrahedra, which fit together perfectly in 6-space, have been forced into 3-space. For an analogous case, consider three equilateral triangles. In 3-space they can fit together with shared edges and a common vertex as three sides of a regular tetrahedron. But the triangles cannot be put together with shared edges and a common vertex on a two-dimensional plane without changing the angles and edge lengths.
Cylindrical Coordinates
The points in the FFD model's Color Space also have cylindrical coordinates r = Saturation, θ = Hue, and z = Value. Hue, Saturation, and Value are determined by the FFD’s output values: Saturation = Red + Green + Blue + Yellow, Value = White – Black, and Hue = the point’s angle of rotation about the Black-White axis.
The cylindrical coordinates transform the octahedral Color Space of Figure B of the Color Vision Model into the more familiar spindle shape in Figure A. This is because the FFD model’s Saturation defines a mathematical metric, or distance, from each point in Figure 2 to the Black-White line segment, and this metric is constant on each square cylinder centered on the Black-White line segment. Since the set of points equidistant from a line defines a circular cylinder, the Saturation metric transforms the square cylinders within Figure B of the Color Vision Model into circular cylinders within Figure A. The spindle shape of Figure A is determined by the restriction r + |z| <= 1, which follows from the sum of the FFD responses being 1. Figures A and B are topologically equivalent. They represent the same Color Space of RAM responses but with different coordinate systems.
Note that a circular depiction of Color Space is not necessary for cylindrical coordinates. The cylindrical coordinates determine each point in Figure B as well as in Figure A. Select HSV (Hue, Saturation, Value) in Figure B’s pull-down menu to see cylindrical coordinates depicted as shown for two dimensions in Figure 2C. Hue and Saturation are polar coordinates in two-dimensional cross sections of Color Space. To produce an approximation of Figure 2C in the middle horizontal cross section of Figure B, set the photoreceptor responses at S = 100, M = 55, and L = 20.